

GIS Analysis and Application (GEOG 361) Senior Project
Introduction
This project seeks to develop a deeper understanding of the relationship between
snowpack and streamflow in the Colorado River Basin. It has been well established that as the climate is warming:
- a greater proportion of precipitation is falling as rain rather than snow,
- snowpack is declining,
- & spring snowmelt is occurring earlier in the year.2
The environment throughout the Colorado River Basin is primarily arid, and snowpack of the high altitude Rocky Mountains provides approximately 70% of the river’s annual runoff.1 Snowpack is the primary source of water for many of the major streams and rivers throughout the region in the form of spring melt, resulting in seasonal runoff patterns dominated by snow accumulation in winter months and spring melt. Understanding the relationship between the winter snowpack and streamflow is essential for proper water management and water allocation throughout the Colorado River Basin where water rights and management have been a historic challenge in the relatively dry environment. The river as a whole is heavily regulated via the Colorado River Compact of 1922, and it has the most complete allocation of water resources of any river in the world.1 Water resources throughout the basin are carefully balanced as the Colorado provides drinking water for 22 of the 32 largest cities across the American West, and it is a critical water source for agricultural irrigation and food production.2

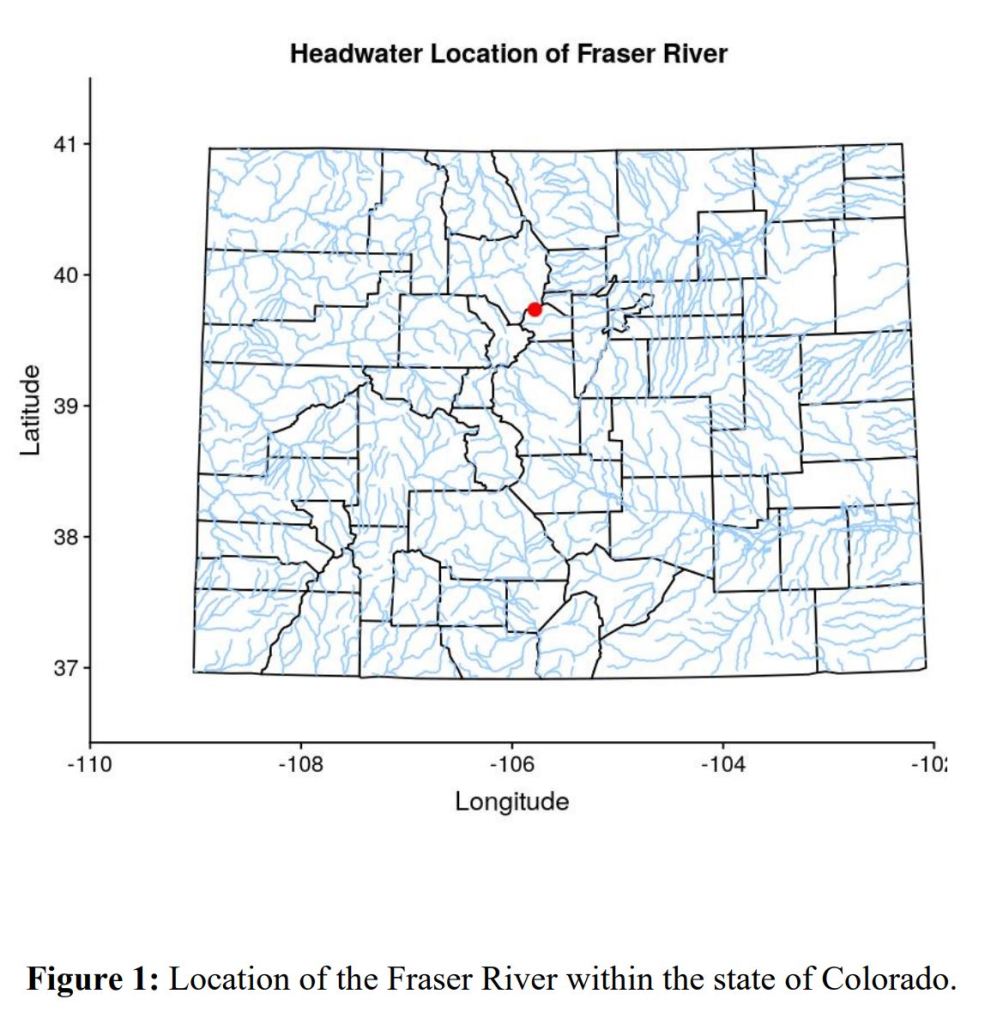
This project focuses on the Fraser River, a tributary to the Upper Colorado
River, where the flow response of a specific tributary with a large snow catchment can be better understood, rather than generalizing to the scale of a larger basin as previous studies have examined.
Understanding linkages between snowpack on the flow of specific tributaries can enhance the understanding of larger scale basins reliant on spring snowmelt and enhance water management in response to changes in snowpack. In the Colorado River Basin, approximately 90% of the annual streamflow is generated from the Upper Basin where the Fraser River is located.1 A smaller scale analysis in a key tributary may improve water management practices and resiliency to climate change at more local scales. Currently in the Fraser River Basin, water is diverted via the Moffat Tunnel east across the continental divide supplying water to the City of Denver. Knowledge of how the snow and streamflow in this basin will change in the era of climate change will be essential for water management practices within the Fraser River Basin itself, and in the greater Denver area.
Methods
Data Used
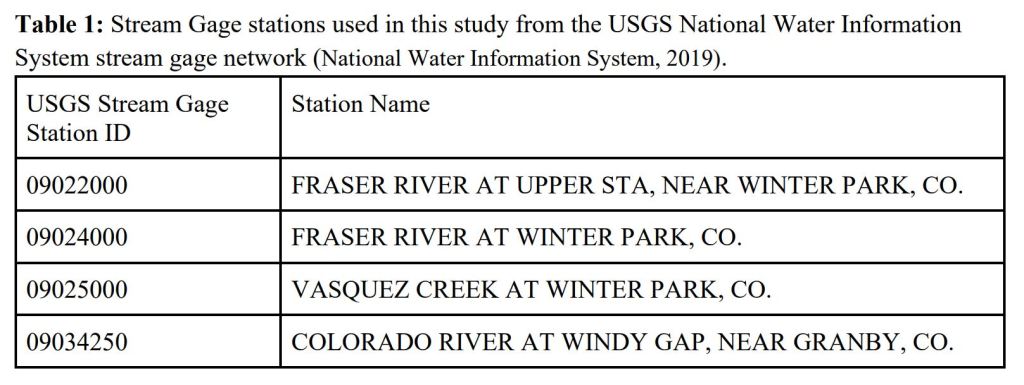
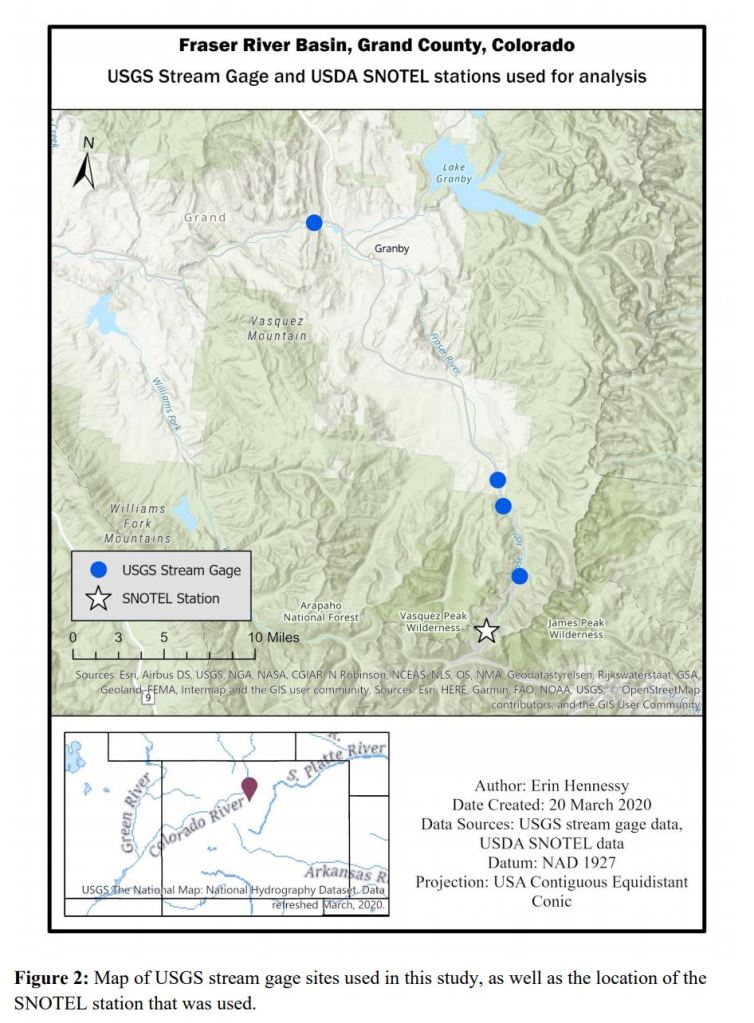
- Streamflow gage data from the USGS was retrieved for four (4) stations along the Fraser River, a tributary to the Upper Colorado River.
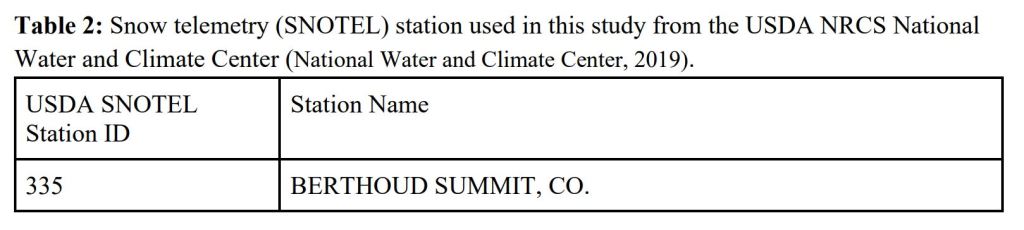
- Snowpack data was retrieved from one (1) Snow Telemetry (SNOTEL) station located on the Berthoud Pass summit managed by the USDA.
The snow water equivalent (SWE) measurement was used from the SNOTEL station as a metric for the snowpack in the Fraser River Basin.3 The discharge in cubic feet per second was used as the metric for streamflow from the stream gage records.4 For both the stream and snow data, the entire record of the data was used for exploratory data analysis; however, only the years 1980 through 2017 were used for the primary spatial analysis.
Analysis
First, time series of both the stream gage flow and the SNOTEL station SWE were plotted to develop a general idea of the phenological cycles for both of these processes. From these initial time series plots it was evident that in the Fraser River Bains, the peaks in SWE and stream discharge do not occur during the same times of year. To adjust for this, lagged correlations were calculated using Pearson’s Correlation Coefficients for each of the stream stations. The lagged correlations were then plotted to determine the appropriate lag to use for the remainder of the analysis. Using the appropriate lag between the SWE and the stream discharge, the correlations coefficients were then mapped along the Fraser River and color coded to correspond with the r-value.
Results
- The streamflow and snowpack have well established maxima (peaks) and minima (lows) throughout the year that do not occur at the same time as each other.

- The streamflow discharge (Figure 3) peaks during the month of June for all four stations.
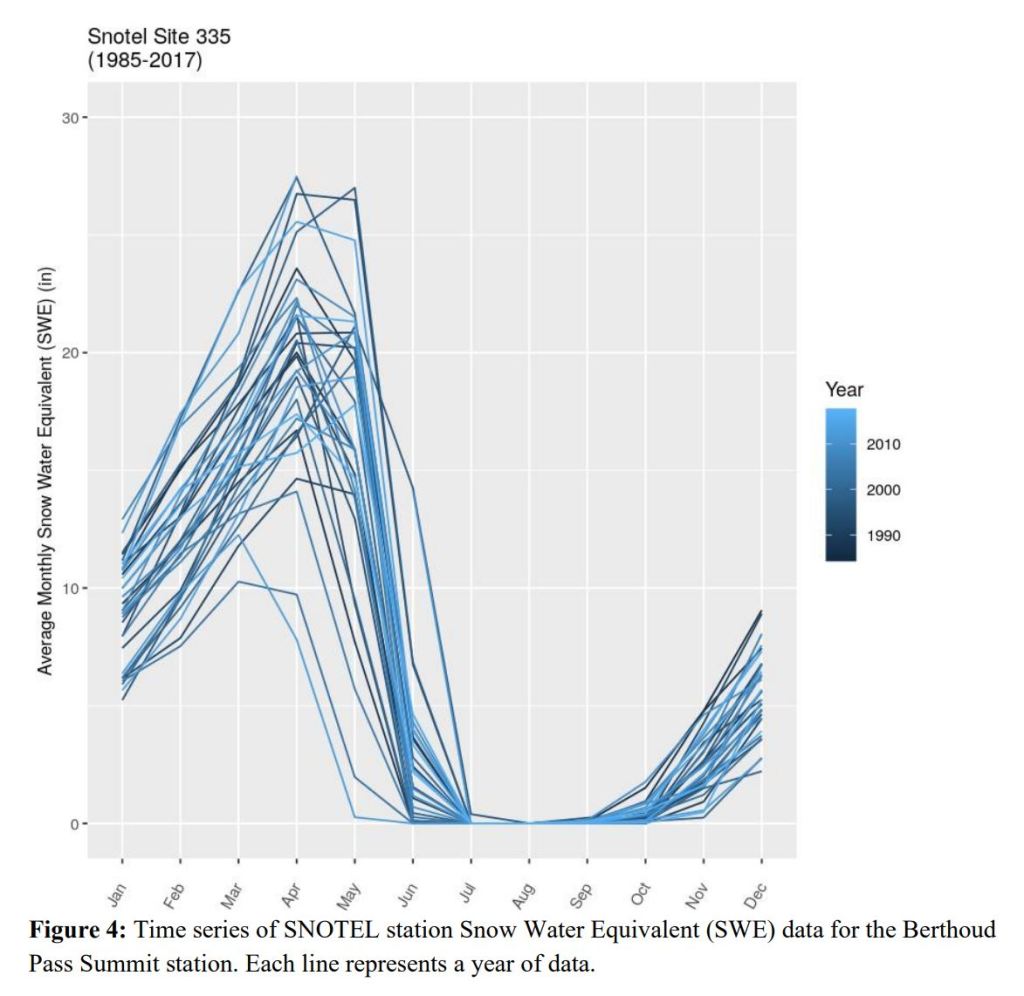
- Whereas the SWE at the SNOTEL station (Figure 4) peaks during the month of April or May depending on the year
- Through these time series, there is evidence of inter-annual variability (changes from year to year) and shifts in the timing of the peaks in the SWE and the streamflow discharge over time.
Because the SWE and the streamflow discharge are not insync, in order to calculate correlation between the SWE record and the streamflow records that reflect the greatest relationship between the two, lagged correlations were calculated. These lagged correlations are plotted for each stream gage in Figure 5. From this plot, it is clear that when the SWE SNOTEL record is lagged by ten months, it has the greatest correlation with the streamflow record at all four stations. Moving forward in the analysis, this ten month lagged correlation was used since that is when the snowpack SWE is most related to the streamflow discharge.

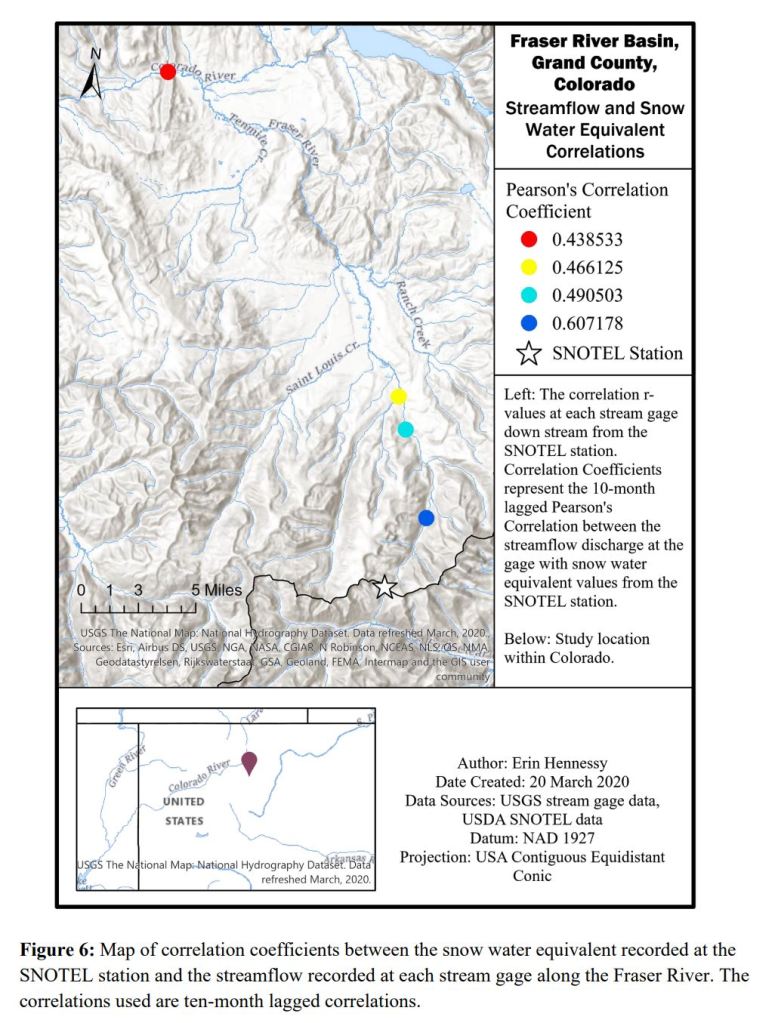
Using the ten-month lagged correlation between each of the stream gage stations and the SWE record of the snowpack, the correlation coefficients were mapped as shown in Figure 6. Each dot representing a stream gage is color coded to correspond with the correlation coefficient. From this map it is clear that moving further downstream from the SNOTEL station, the correlation of the streamflow with the snowpack decreases. These correlations had extremely small p-values (Table 3) allowing for the rejection of a null hypothesis that the snowpack SWE and streamflow discharge are unrelated to one another.
Discussion
Main conclusions:
- the intra-annual phases of streamflow and snowpack in the Fraser River Valley follow strong seasonal patterns.
- The streamflow at all of the stations studied along the Fraser River are most related to the snowpack measured at the Berthoud Pass Summit from ten months prior. This gives some indication that the snowpack is remaining at this location over the summer months, so not only is the current year’s snow accumulation valuable for streamflow, but so is remaining snow from the year prior.
- Finally, in this river basin it is clear that the streamflow is dominated by the snowpack as the correlation between the streamflow and the snowpack is large nearest to the SNOTEL station and decreases downstream. This is especially apparent when these results are compared with results from the Bull Run River on Mount Hood, Oregon where the hydrology seems to be more dominated by rainfall than snowpack.
A potential factor contributing to the decrease in the stream gage correlation down river is human management of the Fraser River including the rerouting of water through the Moffat Tunnel near Winter Park. In the future, these spatial analysis methods could be used to analyze changes over time. Smaller periods of the snowpack and streamflow records could be correlated throughout time to examine whether they change dramatically with a warming climate or more human management. These methods could also be adopted for analysis of other streams in the region.
References
[1] Christensen, N. S., Wood, A. W., Viosin, N., Lettenmaier, D. P., & Palmer, R. N. (2004). The Effects of Climate Change on the Hydrology and Water Resources of the Colorado River Basin. Climatic Change, 62 (1-3), 337-363. http://doi.org.10.1023/B:CLIM.0000013684.13621.1f.
[2] Saunders, S., & Easley, T. (2018). Climate Change in the Headwaters: Water and Snow Impacts. Northwest Colorado Council of Governments. http://nwccog.org/wp- content/uploads/2018/02/Climate-Change-in-the-Headwaters.pdf.
[3] National Water and Climate Center (2019). Berthoud Summit SNOTEL. [Data set]. United States Department of Agriculture (USDA) Natural Resources Conservation Service (NRCS).
https://wcc.sc.egov.usda.gov/nwcc/site?sitenum=335.
[4] National Water Information System (2019). USGS 09022000 FRASER RIVER AT UPPER STA, NEAR WINTER PARK, CO. [Data set]. United States Geological Survey (USGS).
https://waterdata.usgs.gov/nwis/inventory?agency_code=USGS&site_no=09022000.
[5] National Water Information System (2019). USGS 09024000 FRASER RIVER AT WINTER PARK, CO. [Data set]. United States Geological Survey (USGS).
https://waterdata.usgs.gov/nwis/inventory?agency_code=USGS&site_no=09024000
[6] National Water Information System (2019). USGS 09025000 VASQUEZ CREEK AT WINTER PARK, CO. [Data set]. United States Geological Survey (USGS).
https://waterdata.usgs.gov/nwis/inventory?agency_code=USGS&site_no=09025000.
[7] National Water Information System (2019). USGS 09034250 COLORADO RIVER AT WINDY GAP, NEAR GRANBY, CO. [Data set]. United States Geological Survey (USGS).
https://waterdata.usgs.gov/nwis/inventory?agency_code=USGS&site_no=09034250.
